The Analyst Agent in Microsoft 365 Copilot
← the data-analysis agent in Microsoft 365 Copilot — point it at your spreadsheets and ask a plain-English question, get back insights, charts and tables
On this page
The hub for this series — Microsoft 365’s Built-in Agents — maps every agent Microsoft ships. This spoke is the detailed walkthrough of Analyst; its sibling is the Researcher agent.
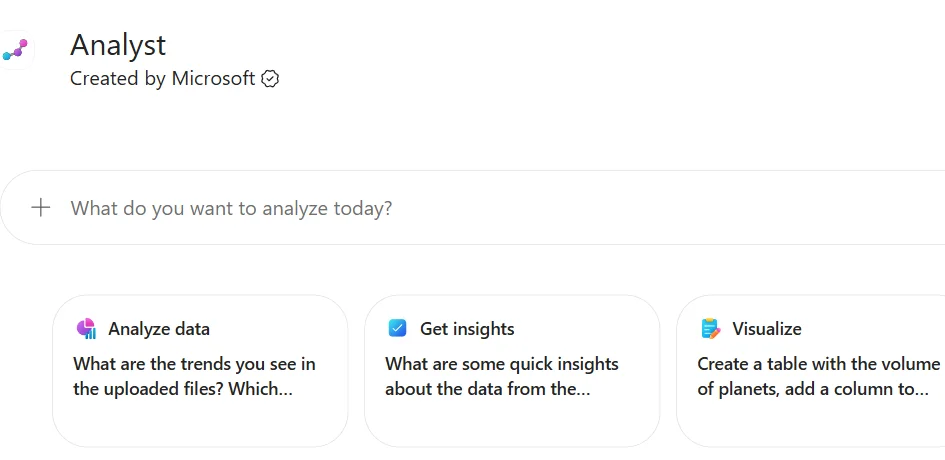
The Analyst home in the Microsoft 365 Copilot app — find it under Agents, next to Researcher. The three starter cards (Analyze data, Get insights, Visualize) are a quick way in. (Screenshots here use a fictional sample dataset.)
Where to find Analyst: under Agents in the Microsoft 365 Copilot app, right next to Researcher.
TL;DR
- Analyst is a built-in agent in the Microsoft 365 Copilot app that turns raw data into insights — attach files, ask a plain-English question, get a readable report with charts and tables.
- It’s built for the cross-file job: consolidate multiple spreadsheets / CSVs and reason across them — more than Copilot can do inside one sheet.
- Under the hood it’s OpenAI’s o3-mini reasoning model and it can write and run code (Python) — and you can watch the code run if you want to check its work, or just take the results.
- On-switch: a Microsoft 365 Copilot licence. Find it under Agents, next to Researcher.
- You don’t have to be a data analyst — that’s the whole point.
- Not in government clouds (GCC, GCC High, DoD) yet.
🧭 Jump to: What it is · Analyst vs Copilot in Excel · How to use it · Example prompts · Researcher or Analyst? · Licensing · Limits · Sources
What Analyst actually is
Analyst is, in Microsoft’s words, “an AI-powered assistant for data analysis… like having a skilled data analyst on hand to help you make sense of data quickly without requiring advanced expertise.”
The job it removes is the tedious one: looking through thousands of rows across multiple files, trying to consolidate them, and then working out what they mean. You hand Analyst the files and a question, and it calculates the statistics, identifies the trends, surfaces the outliers, and writes it up in plain language with charts and tables.
It’s built on OpenAI’s o3-mini reasoning model and uses chain-of-thought reasoning — it works through a problem in steps, taking as many as it needs to refine the answer, and it can write and run Python to do the heavy lifting. You can view the code it runs in real time and check its work — or just take the insight.
Analyst vs Copilot in Excel
Easy to confuse, genuinely different:
| Copilot in Excel | The Analyst agent |
|---|---|
| Helps you inside one workbook | Works across multiple files at once |
| Formulas, charts, analysis in the sheet | Consolidates spreadsheets, CSVs, other data |
| “Help me in this spreadsheet” | “Make sense of all of this data” |
| Lives in Excel | Lives in the Microsoft 365 Copilot app |
If your data lives in one sheet, Copilot in Excel is right there. If the story is spread across several files, that’s Analyst.
How to use it
- Open the Microsoft 365 Copilot app and select Analyst under Agents.
- Type a question about the data you want to analyse.
- Select the + icon, then Attach content, and supply the file(s) — upload from your device or pick from OneDrive.
- Let it work — it consolidates and analyses the data, reasoning through it step by step.
- Read the report — plain-English findings with the charts and tables to back them up.
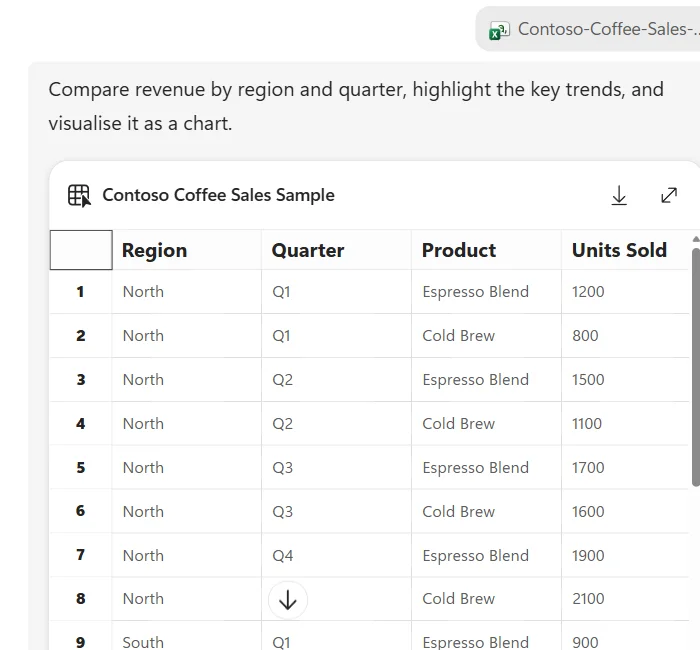
Attach your data, then ask in plain English. Here a sample sales spreadsheet is attached and the question is “compare revenue by region and quarter… and visualise it as a chart.” Analyst echoes the data it’s working from, then gets to work.
Example prompts — what you can actually ask it
The pattern that works every time: attach your files first, then ask a specific question — not “analyse this,” but “compare X by Y and tell me the trend.” Microsoft’s own starter prompts, plus more in the same shape, grouped by the job you’re doing:
Sales & revenue (Microsoft’s own example prompts)
📎 “Compare sales data by region and quarter and highlight key trends.”
📎 “Identify top-performing products or services based on customer engagement metrics.”
Customers & retention (based on Microsoft’s described use cases)
📎 “Identify our top customers who aren’t fully using the products they’ve purchased.”
📎 “Show how discounts affected customer behaviour over the last year.”
Product & marketing
📎 “Visualise product sentiment and usage trends to inform our go-to-market plan.”
📎 “Find the outliers in this dataset and explain what might be driving them.”
Microsoft’s own write-up describes people using Analyst to assess how discounts affect customer behaviour, find customers who aren’t fully using what they bought, and visualise sentiment and usage trends — the kind of question you’d normally hand to a data analyst and wait a day for.
Ask it to compare and it does the maths for you — pivoting your raw rows into a clean table you can actually read (and it’ll draw the chart from the same data too):
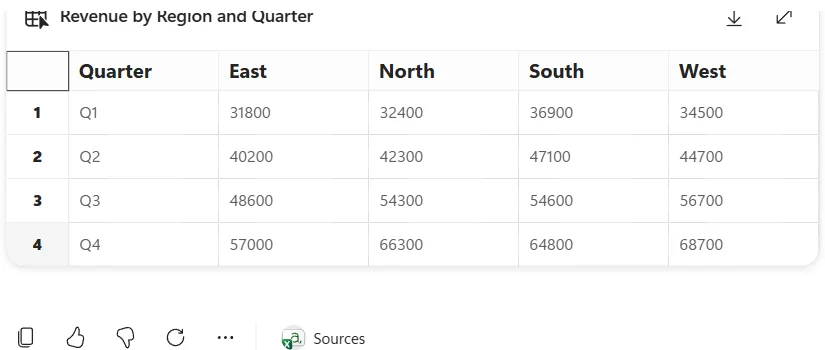
What comes back: Analyst has pivoted the raw spreadsheet into revenue by region and quarter, figures computed for you — and the totals it worked out put West and South ahead with East trailing. The Sources button (bottom) shows the file it drew the numbers from.
🧩 A good habit: ask one clear question per run. If you need five things, that’s often five sharper prompts — each gets a cleaner answer than one sprawling “tell me everything about this data.”
📎 Tip: because Analyst can run code, you can use the code-view option to inspect the Python it ran — so you (or a real analyst) can check the method, not just the answer.
Researcher or Analyst — which one?
Analyst has a sibling, the Researcher agent, in the same place. They look similar but do opposite halves of “knowledge work”:
| You have… | You want… | Reach for… |
|---|---|---|
| A question about a topic | Deep research + a cited report | Researcher |
| Spreadsheets and raw data | Consolidated data insights + charts | Analyst |
Both are reasoning agents, both sit under Agents in Microsoft 365 Copilot, and they came out of the same June 2025 launch. Many people use both — Researcher to gather the picture, Analyst to crunch the numbers behind it.
Licensing
- Licence: a Microsoft 365 Copilot licence, or a Microsoft 365 Premium or Pro subscription. Analyst debuted in April 2025 through the Frontier program and reached general availability on 2 June 2025.
- Where: the Microsoft 365 Copilot app, under Agents.
- Allowance: included with the licence; at general availability a Microsoft 365 Copilot licence included 25 combined Researcher + Analyst queries a month, and like Researcher that figure may change — confirm the current number in Microsoft’s docs.
Limits and good-to-knows
- Check the output. It’s labelled as possibly incorrect — sanity-check the numbers and confirm it answered the question you meant.
- It needs the data attached. Analyst works on the files you give it; point it at the right sources for a useful answer.
- Fewer languages than Researcher. At general availability Analyst supported 8 languages (Researcher supported 37), with more added since — check Microsoft’s docs if you work in a non-English language.
- Allowance: at GA a Microsoft 365 Copilot licence included 25 combined Researcher + Analyst queries a month; that figure may change, so confirm the current number.
- Government clouds: not available in GCC, GCC High or DoD yet.
Official Microsoft sources
- Get started with Analyst in Microsoft 365 Copilot
- Researcher and Analyst are now generally available (Microsoft 365 blog)
- Get started with Researcher in Microsoft 365 Copilot
- Microsoft 365 Copilot service description (government-cloud availability)